
Jump to: Methodology | Overall Category Performance | Biggest Winners | Biggest Losers | Full List of Domains
This is an update to our previous post about the impact of COVID-19 on organic search visibility.
It has been over a month since the coronavirus pandemic has become the central focus of our social, economic, and cultural lives around the world.
As we have begun settling into our new culture of “shelter-in-place,” consumer behavior has also adjusted to the stay-at-home orders that have been put in place across the vast majority of the United States and in many other countries.
Those of us who work in the search marketing space have felt the outcomes of these changes directly: changes in consumer behavior translate into changes in online search behavior, and in turn, changes to the search results.
It is not a new development that Google and the other major search engines algorithmically adjust their results based on changes in search intent, or other external factors that result in searchers looking for specific, timely information. One example of this is Google’s QDF (Query Deserves Freshness) formula, which it launched back in 2007 as a means of identifying when searchers want new information, and when they don’t, and serving results accordingly.
It appears we are seeing QDF or something similar take place as a result of COVID-19: extreme volatility in the search results, as Google aims to satisfy searchers’ rapidly changing needs, even when those needs are changing every day. Below, we have conducted an analysis of changes in search visibility across 18 key categories over the course of a month to see the extent to which SEO visibility mirrors search demand.
Analyzing Organic Visibility Changes by Category: Methodology
To conduct this analysis, we leveraged the help of two tools: Similarweb and Sistrix. Among its many features, Similarweb maintains lists of the highest-traffic websites (using their proprietary clickstream methodology) broken out by category and medium.
Using this data, we gathered a list of the top 40 sites across 18 business categories we thought would be interesting to analyze in the context of the coronavirus:
- Addictions & Recovery
- Alternative & Natural Medicine
- Arts & Entertainment
- Beauty
- Faith & Religion
- Fashion and Apparel
- Finance
- Food & Drink
- Health
- Home and Garden
- Music
- News & Media
- Nutrition & Fitness
- Real Estate
- Restaurants & Delivery
- Romance & Relationships
- TV, Movies & Streaming
- Video Games, Consoles & Entertainment
Note: there are many more categories where this came from and we will continue analyzing performance across new categories in upcoming posts.
To gauge organic visibility, we used the Sistrix U.S. Visibility Index, which measures how visible a domain is (i.e., how well it ranks) across Sistrix’s core set of 1 million “representative” keywords over time. This index makes for a great source of information when measuring a domain’s organic market share in the context of how it ranks across these million keywords relative to other sites.
The Sistrix Visibility Index assigns a value to each domain (or subdomain) every day according to how it ranks against that core set of keywords, also factoring in the search volumes of those keywords.
Note: the Visibility Index is not designed to be a predictor of SEO traffic, as it does not factor in external influences such as seasonality or changes in search volume. Learn more about the differences here.
We then collected the Visibility Index values on two dates: March 9, 2020, and April 9, 2020, to see how visibility had changed across those two dates. Between these dates, the coronavirus became rampantly more widespread throughout the U.S., with many states enacted stay-at-home orders, starting with California on March 20th.
Overall Category Performance:
Winners and Losers by Average Change in Visibility
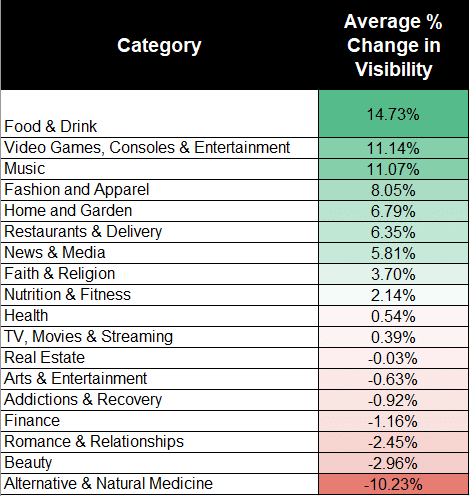
In terms of the average change in visibility between March 9 and April 9, the biggest winners are sites in the ‘food and drink,’ ‘video gaming,’ and ‘music’ categories.
Unsurprisingly, ‘home and garden’ and ‘restaurants and delivery’ also saw big increases in visibility as searchers have been transitioning into their new lifestyles under stay-at-home orders.
It is interesting to note that ‘fashion and apparel’ saw increases in visibility, potentially mirroring the increased intent to shop for clothing online, as a result of physical store closures.
Winners and Losers by Total Change in Visibility Score
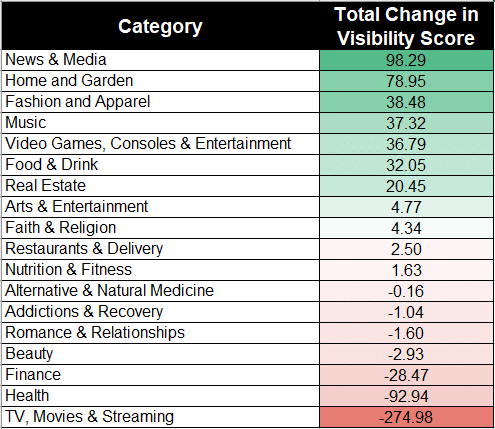
It is also interesting to look at the total change in visibility scores by category to see where the most movement took place.
The massive drop of 274.98 points in the ‘TV, movies and streaming’ category was largely due to a drop in visibility by YouTube, which had previously seen a big uptick at the beginning of the coronavirus outbreak.
‘News and media’ also saw the biggest increase in overall visibility, which is unsurprising given Google’s emphasis on showing news, updates, and current events for most queries related to the coronavirus, and even many queries that don’t inherently seem like time-sensitive queries.
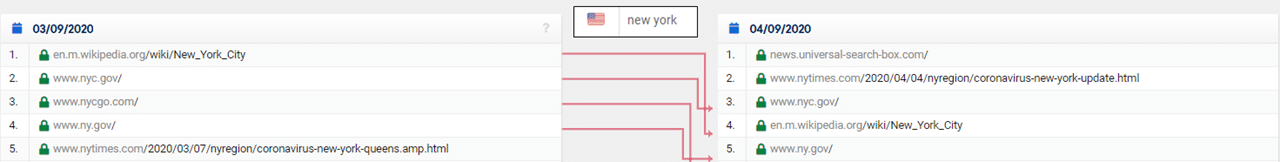
For example, by entering the name of any U.S. state and comparing Google’s top 5 results on March 9 compared to April 9, there is a clear emphasis on surfacing news results (including the top-ranking Top Stories panel) in top positions.
Top 50 Winning Sites Among Analyzed Categories
Below are the top 50 biggest winners in terms of percentage growth in visibility:
Netflix Party, which allows users to watch Netflix shows with their friends, soared in visibility.
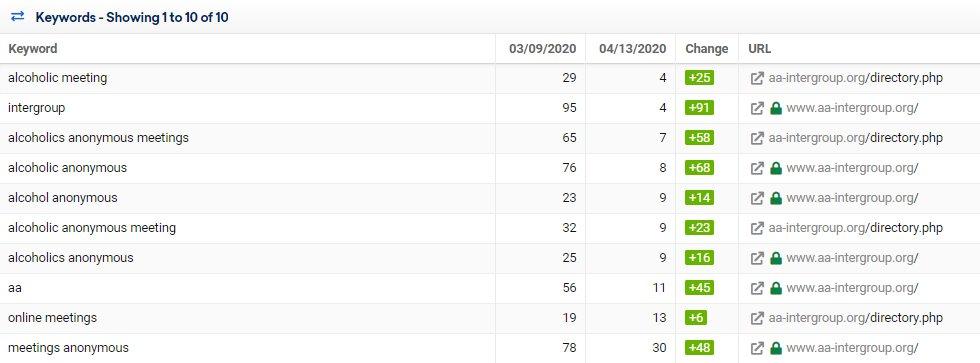
AA-Intergroup and In the Rooms, which both offer virtual Alcoholics and Narcotics recovery meetings and resources, also saw huge upticks in visibility. Interestingly, these sites began to rank for queries not containing the words “online” or “virtual,” such as “Alcoholics Anonymous” and “Alcoholics Anonymous Meetings.”
There was big positive movement among recreational and entertainment sites. Streaming and gaming sites such as HBO Go, HBO Now, Minecraft, and Disney Go saw over 50% increases in visibility. Online radio stations such as KTAR and CPR also saw big upticks as consumers presumably had more time to stream the radio stations from their homes. Relatedly, the medical marijuana site Curaleaf also saw an enormous surge in visibility.
Grocery, food delivery, and recipe sites were also among the biggest winners, such as Meijer, Skinny Taste, and Parade.
Below are the top 50 biggest winners in terms of total increase in visibility score:
Unsurprisingly, the biggest winner in terms of overall visibility gains was Home Depot. The company’s rise in visibility is likely due to its inventory of products like masks, hand sanitizer, and cleaning supplies, as well as a result of the increased time searchers are spending at home. Maybe the search intent has shifted because people getting started on those home improvement projects they’ve been meaning to tackle? (Looking at you, small herb garden.)
Lowe’s was also among the top 10 biggest winners.
The New York Times, which has done a remarkable job with Coronavirus reporting, has also seen an increase of nearly 25 points in visibility during this timeframe, which is no small feat in Sistrix’s index.
Top 50 Losing Sites Among Analyzed Categories
Below are the 50 sites with the biggest losses in terms of percentage decline in visibility:
Note: this chart was filtered to show only those domains with a Visibility Index score of .5 or greater – domains with lower scores tend to see extreme instability due to short-term rankings and tests by Google.
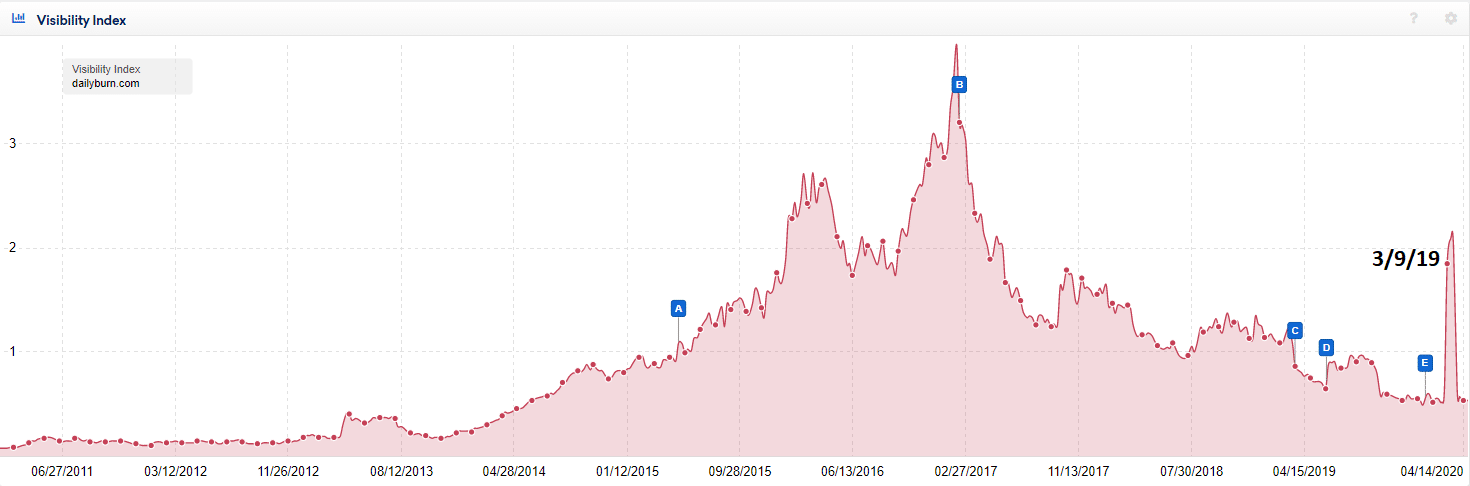
While Daily Burn appears to be the biggest loser in terms of percentage declines, this is slightly misleading – the decline is due to somewhat of a “blip” in visibility that took place in March. When searchers began self-quarantining, there was a surge in demand for home fitness and some other categories, including DIY cleaning products, which resulted in a surge in visibility for Daily Burn. It appears Google later “corrected” that spike in visibility, and Daily Burn fell back to normal levels in late March.
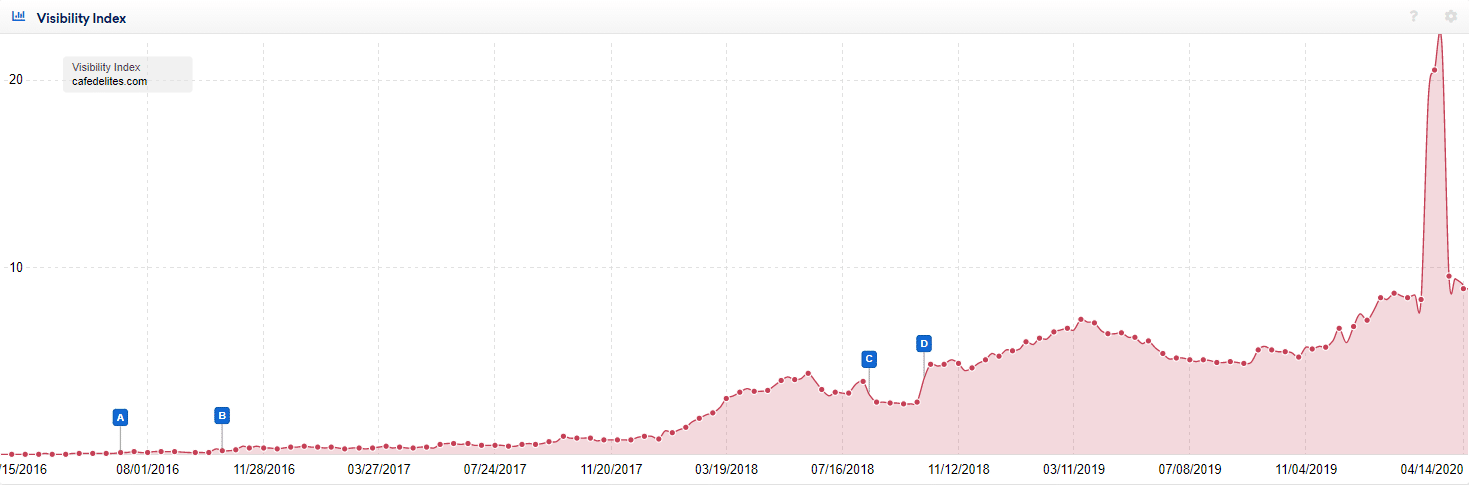
The same is true for the 2nd site with the biggest drop in visibility, Cafe Delights, a cooking site that saw a tremendous uptick in visibility as searchers began staying at home on March 9. Like Daily Burn, Cafe Delights also saw its visibility return to normal levels on March 30.
These fluctuations and “corrections” may be one of the examples of the “side effects” of Google actively working on the algorithms as a response to the coronavirus, as noted by Glenn Gabe in the below tweet:
Both Dunkin Donuts and Starbucks appear on the list of losers, likely as a result of consumers not being able to visit their store locations, and instead, making coffee at home. Indeed, Starbucks recently reported a 47% decline in second-quarter earnings as a result of coronavirus.
Beauty websites Colourpop and The Right Hairstyles both saw big declines in visibility as well. Perhaps this is a result of searchers feeling less of a need to purchase new makeup products or to concern themselves much with their hairstyles, given their inability to go out much in public.
Below are the 50 sites with the biggest losses in total visibility score:
While there appears to be a pattern of some of the biggest health publishers (Healthline, WebMD, Medical News Today, etc.) making it onto the list of biggest losers, the reason for this is similar to the above sites: there was a surge in visibility to these sites during March. This then leveled out at the end of March.
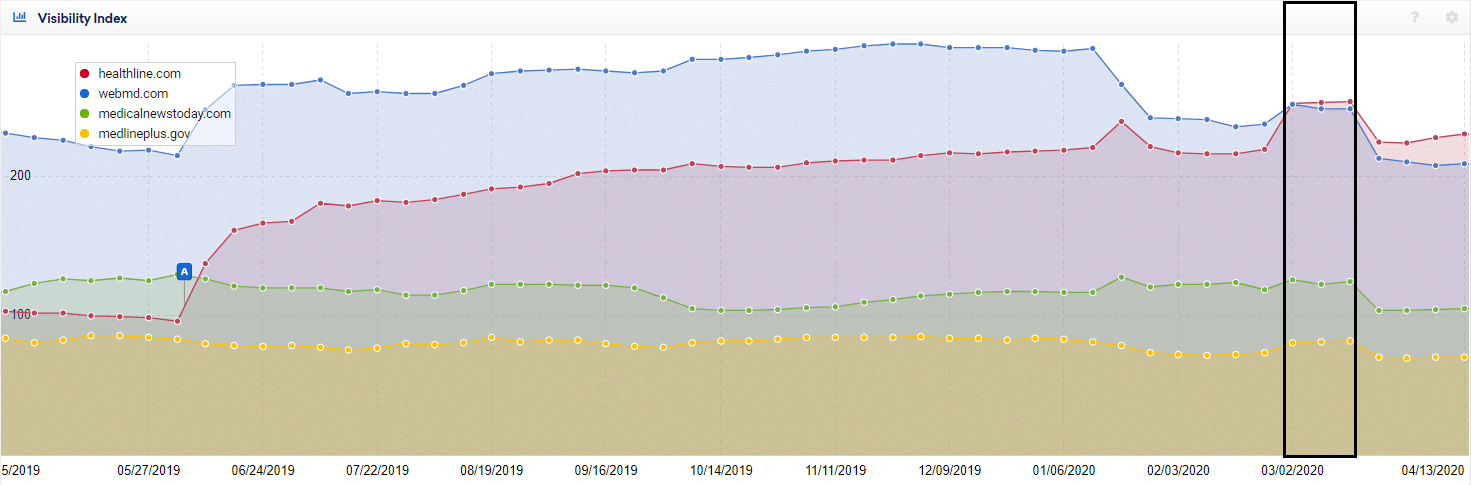
In light of the coronavirus, Google has also begun showing a variety of new search features for many health-related queries, as it aims to reduce misinformation, and ensure that searchers can get accurate, credible information related to COVID-19. This has had the impact of reducing the visibility of many health publishers who are not legitimate government websites, trusted news publications, or organizations backed by the UN.
View the Full List of Analyzed Domains
Shout out to our great SEO Intern, Chaz Marshall, for help pulling the data together for this article!