This blog has been updated to include information regarding metrics changes in March of 2024.
Core Web Vitals is a metric from Google that measures the performance of your pages based on real world usage data. This new report is based on three metrics: LCP, INP (which replaced FID on March 12, 2024), and CLS. If a URL does not have enough data for any of these metrics, the page status will be ranked on the metric with a status of its most poorly performing metric.
Jump To:
Why does this matter?
In May 2020, Google announced that these new metrics will become a factor in ranking websites starting in 2021:
Today, we’re building on this work and providing an early look at an upcoming Search ranking change that incorporates these page experience metrics. We will introduce a new signal that combines Core Web Vitals with our existing signals for page experience to provide a holistic picture of the quality of a user’s experience on a web page.
That means these metrics are now important for SEO if you want your pages to continue performing next year. It should also be noted that—with these new metrics—Google will allow non-AMP pages to rank in their Top Stories feature for the first time. See below:
As part of this update, we’ll also incorporate the page experience metrics into our ranking criteria for the Top Stories feature in Search on mobile, and remove the AMP requirement from Top Stories eligibility. Google continues to support AMP, and will continue to link to AMP pages when available.
Let’s dig a little deeper into each of these metrics to see what they are and how we can measure them.
First Metric: Largest Contentful Paint (LCP)?
Google defines LCP as follows:
The Largest Contentful Paint (LCP) metric reports the render time of the largest image or text block visible within the viewport.
Essentially, this means that the LCP is the largest viewable block of your page that occurs by the time the rendering process is complete. See this example of the CNN website shared by Google:
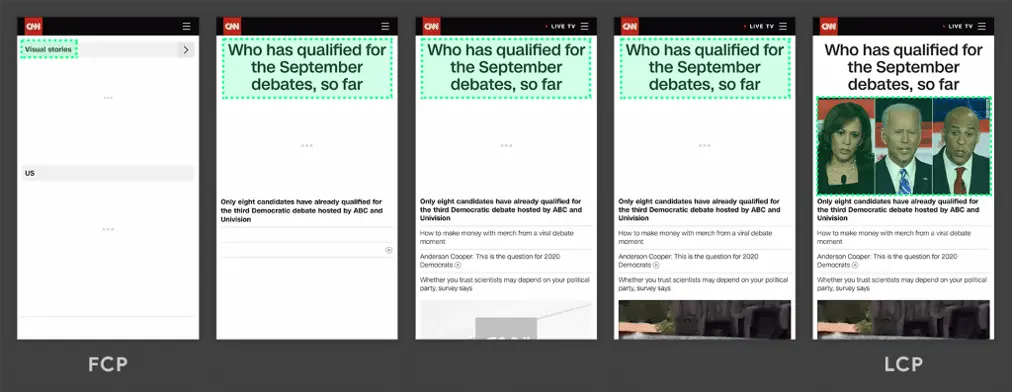
As you can see, the largest element continually changes as the page renders, but only in the final screen do we see the largest element, which is considered the LCP.
To see how this can vary, let’s look at an example from Google demonstrating how the LCP can load in much earlier in the process:
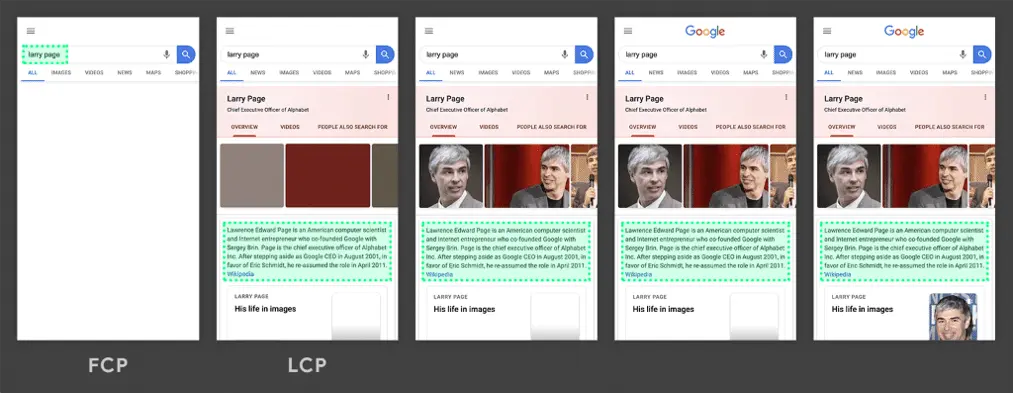
In this example, we see that the LCP has drawn in quite early well before the page has finished rendering. This will result in a much better score.
A good score is considered having the Largest Contentful Paint occur within the first 2.5 seconds of the page load. Anything between 2.5 seconds and 4.0 seconds is considered to need improvement. Beyond 4.0 seconds is considered a poor implementation. See below for a visual example provided by Google:

You can measure LCP via a variety of methods but it’s available now in PageSpeed Insights, Lighthouse within Chrome Devtools or via a chrome extension.
For more information, see Google’s article on Largest Contenful Paint.
Second Metric: Interaction to Next Paint (INP)
As of March 12, 2024, INP has replaced First Input Delay (FID) as a more robust metric for testing the performance of user interactivity.
Google outlined the original metric FID to help define a user’s first impression of your website, and is defined by Google as follows:
FID measures the time from when a user first interacts with a page (i.e. when they click a link, tap on a button, or use a custom, JavaScript-powered control) to the time when the browser is actually able to begin processing event handlers in response to that interaction.
Overtime this metric proved to not be effective at gauging the interactivity performance of web applications, so the alternative INP was proposed and adopted.
The new metric is outlined by Google as follows:
Interaction to Next Paint (INP) is a stable Core Web Vital metric that assesses page responsiveness using data from the Event Timing API. INP observes the latency of all click, tap, and keyboard interactions with a page throughout its lifespan, and reports the longest duration, ignoring outliers. A low INP means the page is consistently able to respond quickly to the vast majority of user interactions.
Unlike FID, which only measured the first interaction on a page, INP measures user interactivity by continually testing the responsiveness of the website as the user interacts with it for the entire duration. The goal is to ensure that the main thread never prevents the user from being able to interact properly with the page or presents the feeling of non-responsiveness to the client.
Google provides the following example:
We recommend reviewing Google’s documentation on how INP is measured when evaluating and improving upon this within your own application. For the purposes of INP, only the following types of interactions are reviewed:
- Mouse Clicks
- Device taps on a touchscreen
- Key presses on either a physical or touchscreen keyboard
Interactions are also recorded within the main document and any embedded iframes. For example, clicking play on an embedded video such as YouTube or Vimeo.
Google states that interactions may consist of multiple events including keydown, keypress, keyup, pointerup and pointerdown events. The one with the longest duration within any interaction will be selected as the interaction’s latency.

The calculation is completed when the user leaves the page, recording the final score of the overall visit to the page.
A good score is considered anything less than 200ms. Scores between 200ms and 500ms are considered as needs improvement, while anything greater than 500ms is rated as poor.

You can measure INP via a variety of methods including PageSpeed Insights, Lighthouse within Chrome Devtools or via a chrome extension. Keep in mind that this cannot be a simulated test as it requires real user interaction to determine the score.
For more information, see Google’s article on Interaction to Next Paint.
Third Metric: Cumulative Layout Shift (CLS)
Cumulative Layout Shift is a new metric based upon one of the web’s most annoying features: shifting content. Google defines it as follows:
CLS measures the sum total of all individual layout shift scores for every unexpected layout shift that occurs during the entire lifespan of the page.
If you’ve ever visited a page and started browsing only to have an ad suddenly pop in and push content out of the way, disrupting your natural reading flow, you’ve experienced a poor CLS implementation.
A good example of why this is a poor experience is demonstrated in this example provided by Google:
This metric aims to rank websites based on better usability. Websites with a poor user experience will rank lower than those with a more enjoyable user experience.
A good CLS score is considered less than 0.1. Between 0.1 and 0.25 is considered needs improvement while anything greater than 0.25 is considered poor.

You can improve your site’s usability by minimizing CLS, which is most notoriously caused by advertisements that load in via JavaScript and drastically alter the layout of a page. Another big no-no would be full-screen ads that appear shortly after visiting a page and completely block visible content.
Keep content shift to a minimum unless necessary via expected items like expandable collapsed menus. (This is considered an expected layout shift and is not penalized by the metric. It is almost always user-initiated.)
Animations and transitions, especially those caused by a CSS transform, are another ideal way to prevent a layout shift from triggering.
You can measure CLS via a variety of methods but it’s available now in PageSpeed Insights, Lighthouse within Chrome Devtools or via a chrome extension.
For more information, see Google’s article on Cumulative Layout Shift.
Web Metrics and SEO
Web performance optimization is only a piece of the puzzle when it comes to driving organic search (SEO) performance. If your web vitals have flatlined, give us a shout and let’s work together.